Markets
Why My Friend Is Smiling Through 2026's Stock Market Chaos (And Most Investors Aren't)
Milan Dang
Founder, NavArth | Financial Planning for Families & Startup Advisory | Ex-JPMorgan | NatWest Group | ICRA | Hindalco | SRF

2026 has been a brutal stress test for Indian equity investors.
Between a US tariff scare, conflict in Iran pushing Brent crude past $110, record foreign selling, a US Fed rate hike, and the RBI's first rate hike in nearly four years, the Nifty 50 has been on a rollercoaster.
At its October 8 low, the index had plunged 15% below its January opening level. Even after staging its sharpest rebound in years, the Nifty remains ~3.2% below its 2025 close of 26,130 — putting its 10-year calendar-year winning streak on thin ice.
Yet, my friend S has stayed remarkably calm — and financially happy — all year.
Her annualized portfolio return dipped from 12.6% in January 2026 to 10.7% in October, and sits at 11.2% today. While others are refreshing their brokerage apps in a panic, she isn't losing sleep. Her secret has nothing to do with predicting oil prices or central bank moves. It comes down to a simple formula that governs how we experience money.
The Financial Happiness Formula
In investing, happiness is rarely about the headline market return. It is about the Expectation Gap — the distance between what your money actually earns and the minimum return you silently expect.
For most Indians, that silent yardstick is the humble Fixed Deposit (FD). This is a rate which is deeply woven into Indian household psychology for generations as safe rate which bank would have paid us no matter what happens to oil prices, interest rates, tariffs or stock market crashes.
With SBI's 2-to-3-year FD paying 6.45% (as of October 2026) and the RBI repo rate at 5.50%, let's call ~6.5% your baseline expectation. That is the guaranteed number your stock portfolio is constantly being judged against.
- Portfolio Return < 6.5%: Anxiety, regret, and sleepless nights.
- Portfolio Return > 6.5%: Peace of mind — and the wider the gap, the happier you feel.
So, what decides whether you end up above or below that 6.5% line? How long you stay invested.
Same Market, Five Different Realities
To see why time changes everything, look at five investors who put the exact same amount into a Nifty 50 index fund, differing only in when they started:
| Investor | Entry Point | Holding Period | Nifty 50 Return | vs. ~6.5% FD Benchmark |
|---|---|---|---|---|
| S | Dec 2015 | 10.9 years | 11.2% p.a. | Well above |
| Investor A | Dec 2020 | 5.9 years | 10.6% p.a. | Well above |
| Investor B | Dec 2021 | 4.9 years | 8.0% p.a. | Above |
| Investor D | Dec 2023 | 2.9 years | 5.4% p.a. | Below |
| Investor F | Dec 2025 | 10.5 months | -3.2% (total) | Below |
My friend S and Investor F own the exact same index. They lived through the exact same 2026 headlines. Yet S is beating an FD by nearly 5% points a year, while Investor F is sitting on a loss.
What 10+ Years of Market Swings Tell Us
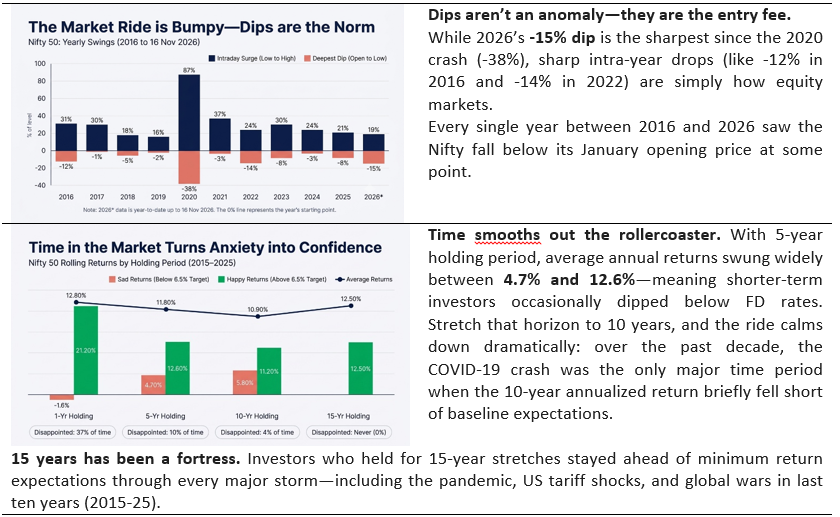
Was my friend just lucky with her entry date? When we zoom out across a decade of Nifty 50 data (2015–2026), three truths stand out:
The Bottom Line
Happiness in the stock market isn't a magic return you chase. Mind your horizon, and the market will take care of the rest — rewarding you with a premium far higher than minimum expectation.
Disclaimer: Investments in securities markets are subject to market risks. This article is for educational purposes only and does not constitute investment advice.